


Earnings season can feel overwhelming. Every few months, companies release thick reports filled with tables, charts, and financial jargon. But here’s the secret: you don’t have to read every page to know whether a company is performing well.
With a little practice, you can scan the most important numbers and get a clear picture of a business in just a few minutes. Here’s how.
The first place to look is the top line (revenue) and the bottom line (earnings per share, or EPS).
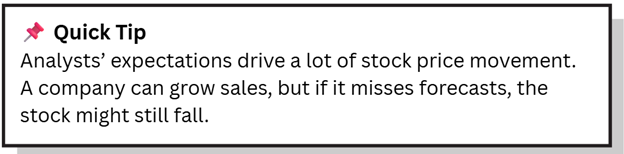
Revenue (sales): Did the company sell more than last year? Did it beat Wall Street expectations?
Technical analysis and fundamental analysis are two primary methods used to research stocks and make investment-related decisions.
EPS (earnings per share): How much profit does each share of stock represent? Was it higher or lower than analysts predicted?
Sales don’t tell the whole story. Margins reveal how efficiently a company turns sales into profits.
Gross Margin: Profit after making the product or service.
Operating Margin: Profit after day-to-day business costs.
Net Margin: Profit after everything—taxes, interest, etc.
Rising margins = stronger efficiency. Shrinking margins = possible cost or pricing problems.
Earnings reports aren’t just about what happened—they also include what management expects next. This is called guidance.
Raised guidance: Management sees better results ahead.
Cut guidance: Management is warning about slower growth.
Why it matters: The market is forward-looking. Often, future guidance moves the stock more than past results.

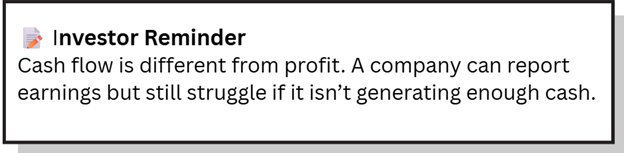
Cash is the lifeblood of a company. Even profitable businesses can run into trouble if they don’t generate enough cash. Look for:
Operating Cash Flow / Free Cash Flow: Is the company generating real cash after expenses?
Debt Levels: Is debt climbing faster than cash reserves?
Strong cash flow = financial flexibility. High debt = risk if conditions worsen.
After the report, management usually hosts an earnings call. This gives investors context around the numbers.
What challenges are they facing (costs, competition, demand)?
Where are they seeing growth (new products, technology, global expansion)?
How do they view the economy overall?
If you only have a few minutes, here’s your three-step scan:
1. Revenue & EPS vs. expectations: Did the company beat or miss?
2. Guidance: Is the outlook stronger or weaker?
3. Margins: Are profits improving or under pressure?
Earnings reports don’t need to be intimidating. By focusing on revenue, earnings, margins, guidance, and cash flow, you can quickly separate strong performers from struggling companies. Everything else is just detail.
The more you practice, the faster this becomes—eventually, you’ll be able to size up a report in just a few minutes, just like the pros.
Remember: a single earnings report is just one piece of the puzzle. It’s always a good idea to do as much research as possible before buying a stock.
When you have more time to dig deeper, check out our step-by-step guide on How to Analyze Stocks. It walks you through valuation, competitive advantages, and other important metrics that matter just as much as quarterly results.


")
