Updated: 25-Aug-25 10:21 ET


Highlights
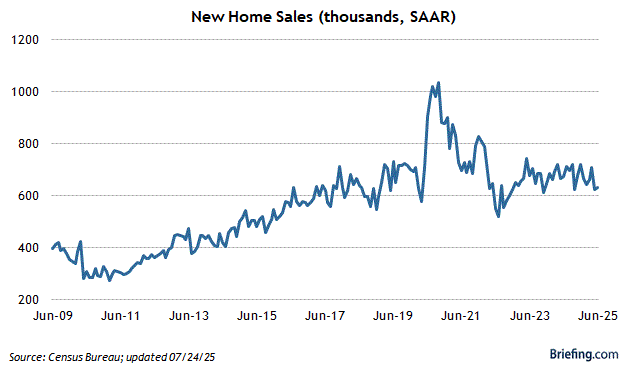
- New home sales decreased 0.6% month-over-month in July to a seasonally adjusted annual rate of 652,000 units (Briefing.com consensus 630,000) from an upwardly revised 656,000 (from 627,000) in June.
- On a year-over-year basis, new home sales were down 8.2%.
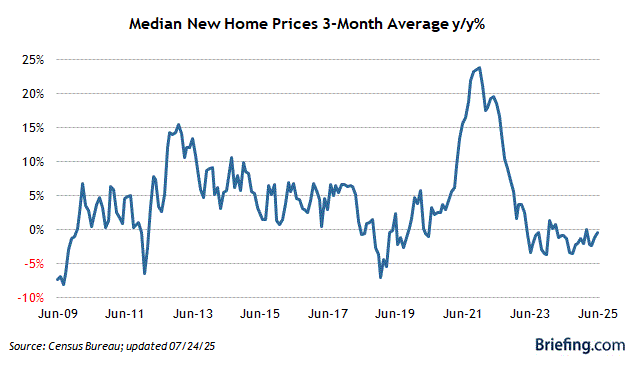
- The median sales price decreased 5.9% yr/yr to $403,800, while the average sales price declined 5.0% yr/yr to $487,300.
- New home sales month-over-month/year-over-year by region: Northeast (0.0%/-23.5%); Midwest (-6.6%/+4.9%); South (-3.5%/-4.0%); and West (+11.7%; -19.2%).
- At the current sales pace, the supply of new homes for sale stood at 9.2 months, versus 9.2 months in June and 7.9 months in the year-ago period.
- The percentage of new homes sold for $399,000 or less accounted for 50% of new homes sold versus 48% in June. Homes priced between $400,000 and $799,000 accounted for 46% of new homes sold versus 44% in June. New homes priced at $800,000 or over accounted for 6% of sales in July versus 9% in June.
- The key takeaway from the report is that the pace of sales was sluggish, owed in part to the upward revision for June. However, the affordability constraint associated with higher mortgage rates and a reduced supply of lower-priced homes was evident, as sales were lackluster month-over-month despite a drop in median and average selling prices.
| Category | JUL | JUN | MAY | APR | MAR |
| Total Sales | 652K | 656K | 630K | 706K | 660K |
| Inventory (months) | 9.2 | 9.2 | 9.6 | 8.5 | 9.2 |
| Median Price Y/Y | -5.9% | -1.6% | 2.1% | -0.4% | -5.4% |


