

Updated: 18-Mar-26 09:24 ET
Highlights
- The Producer Price Index for final demand increased 0.7% month-over-month (Briefing.com consensus: 0.3%) following a 0.5% increase in January. The Producer Price Index for final demand, less foods and energy, jumped 0.5% month-over-month (Briefing.com consensus: 0.4%) following a 0.8% increase in January.
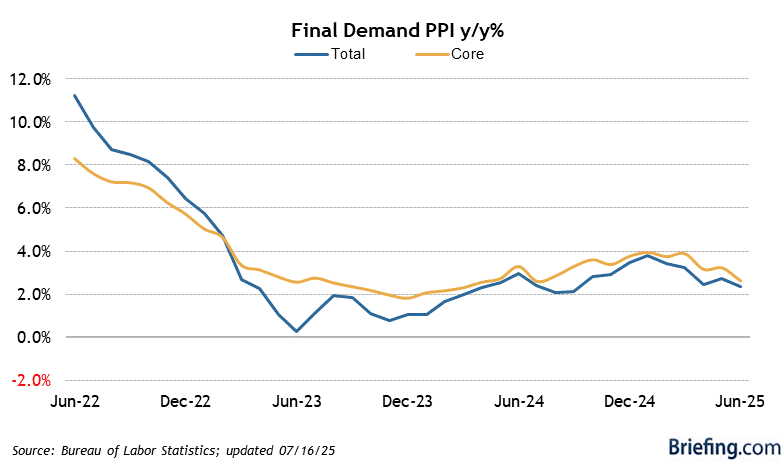
- On a year-over-year basis, the Producer Price Index for final demand was up 3.4%, versus 2.9% in January, and the Producer Price Index for final demand, less foods and energy, was up 3.9%, versus 3.6% in January.
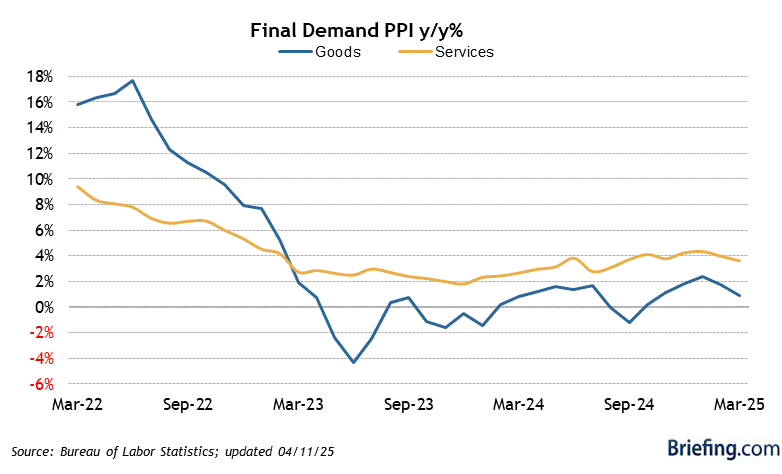
- The index for final demand goods increased 1.1% following a 0.2% decline in January. That was the largest increase since August 2023, and 40% of the increase was attributed to the index for final demand foods.
- The index for final demand services jumped 0.5%, driven largely by a 0.6% increase in the index for final demand services less trade, transportation, and warehousing.
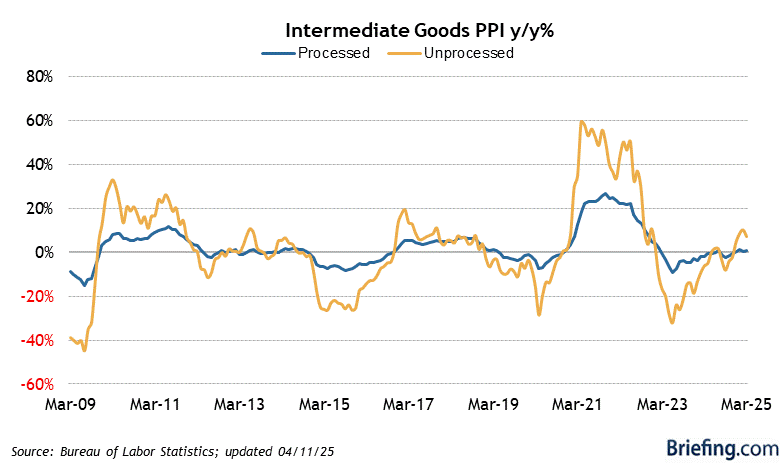
- The index for processed goods for intermediate demand rose 1.6%, which was the largest increase since August 2023.
- The index for unprocessed goods for intermediate demand surged 3.1%, the biggest increase since January 2025, with 60% of the increase due to prices for unprocessed energy materials.
- The key takeaway from the report is that the uptick in producer prices was seen in both goods (+1.1%) and services (+0.5%), and the added point is that this higher inflation occurred before the war with Iran and subsequent surge in energy prices, which will foment concerns about a worsening inflation situation.
| Category | FEB | JAN | DEC | NOV | OCT |
| Final Demand | 0.7% | 0.5% | 0.4% | 0.3% | 0.1% |
| Core (excluding ...) | |||||
| Food and Energy | 0.5% | 0.8% | 0.5% | 0.1% | 0.3% |
| Food, Energy, and Trade | 0.5% | 0.4% | 0.2% | 0.2% | 0.6% |
| Final Demand Goods | |||||
| Total | 1.1% | -0.2% | -0.1% | 0.8% | -0.2% |
| Energy | 2.3% | -2.3% | -1.5% | 3.5% | -2.2% |
| Finished Goods | 1.0% | -0.6% | -0.1% | 0.9% | -0.4% |
| Final Demand Services | |||||
| Total | 0.5% | 0.8% | 0.6% | 0.0% | 0.2% |
| Trade | 0.4% | 2.2% | 1.9% | -0.5% | -0.9% |
| Intermediate Demand | |||||
| Processed | 1.6% | 0.1% | 0.1% | 0.6% | -0.1% |
| Unprocessed | 3.1% | 0.9% | 2.1% | 1.3% | -1.3% |
| Services | 0.8% | 0.6% | 0.5% | 0.2% | 0.4% |

")
