Updated: 03-Sep-26 10:21 ET
Highlights
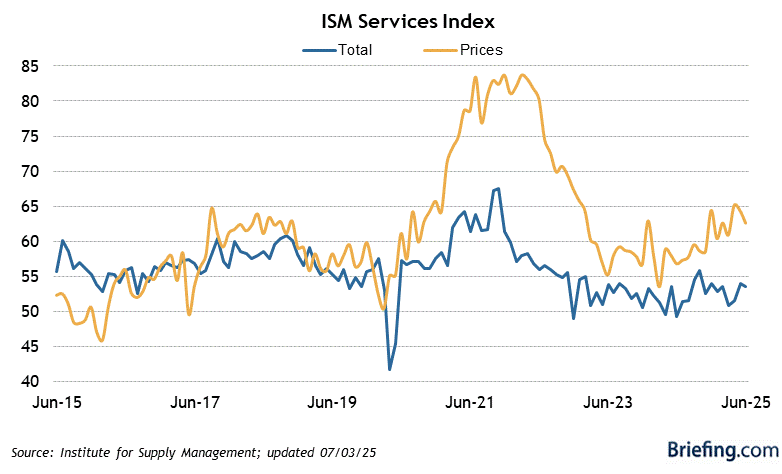
- The ISM Services PMI increased to 55.4% in August (Briefing.com consensus: 54.1%) from 54.1% in July.
- The dividing line between expansion and contraction is 50.0%, so the August reading reflects services sector activity growing at a faster pace than the prior month.
- The Business Activity/Production Index increased to 61.7% from 59.1%.
- The New Orders Index rose to 60.9% from 57.2%.
- The Employment Index edged up to 47.8% from 47.4%.
- The Prices Index increased to 72.6% from 70.3%, marking the twenty-first consecutive month above 60.0% and the highest reading since August 2022.
- The Supplier Deliveries Index slipped to 51.3% from 52.8%.
- The Backlog of Orders Index jumped to 55.6% from 50.9%.
- The key takeaway from the report is that it shows services organizations haven't seen any relief in the prices they are paying for materials and services. That invites the risk of pass-through to customers and sustained inflation issues.
| Category | AUG | JUL | JUN | MAY | APR |
| Non-Manufacturing ISM index | 55.4 | 54.1 | 54.0 | 54.5 | 53.6 |
| Business Activity | 61.7 | 59.1 | 55.4 | 57.7 | 55.9 |
| New Orders | 60.9 | 57.2 | 55.1 | 57.3 | 53.5 |
| Employment | 47.8 | 47.4 | 51.2 | 47.9 | 48.0 |
| Deliveries (nsa) | 51.3 | 52.8 | 54.4 | 55.2 | 56.8 |
| Inventories (nsa) | 56.7 | 51.4 | 51.2 | 62.5 | 53.1 |
| Exports (nsa) | 56.3 | 52.0 | 50.4 | 50.0 | 52.1 |
| Imports (nsa) | 56.3 | 51.8 | 49.4 | 51.1 | 54.7 |
| Prices Paid | 72.6 | 70.3 | 67.7 | 71.3 | 70.7 |