Updated: 26-Sep-25 09:21 ET


Highlights
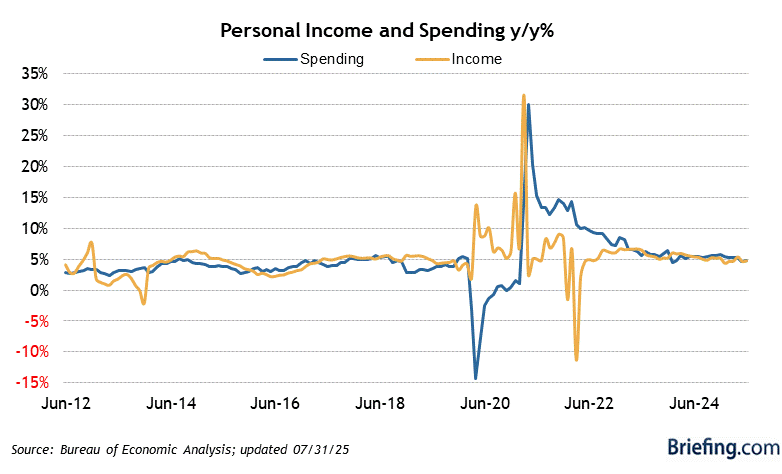
- Personal income increased 0.4% month-over-month in August (Briefing.com consensus: 0.3%) following a 0.4% increase in July.
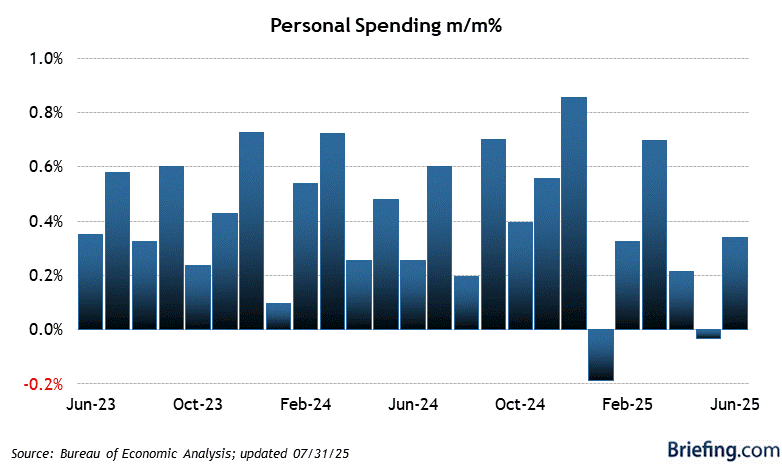
- Personal spending jumped 0.6% month-over-month (Briefing.com consensus: 0.4%) following a 0.5% increase in July.
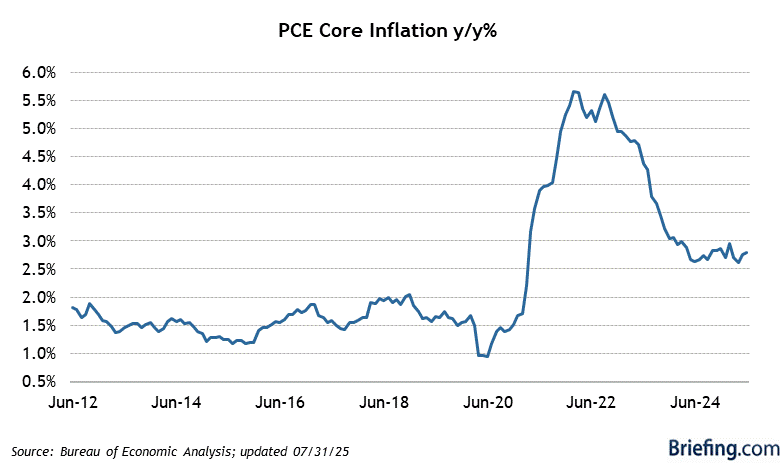
- The PCE Price Index was up 0.3% month-over-month, as expected, and the core PCE Price Index, which excludes food and energy, was up 0.2%, also as expected.
- On a year-over-year basis, the PCE Price Index was up 2.7%, versus 2.6% in July, and the core PCE Price Index was up 2.9%, unchanged from July.
- The PCE Price Index for Goods was up 0.1% month-over-month and up 0.9% year-over-year versus 0.6% in July.
- The PCE Price Index for Services was up 0.3% month-over-month, leaving it up 3.6% year-over-year versus 3.5% in July.
- Wages and salaries increased 0.3% month-over-month after increasing 0.5% in July.
- Rental income was up 0.4% month-over-month after increasing 0.2% in July.
- Personal interest income was up 0.1% month-over-month after increasing 0.1% in July. Personal dividend income was up 0.1% month-over-month following a 0.2% increase in July.
- Real disposable income was up 0.1% month-over-month and was up 1.9% year-over-year versus 1.9% in July. Real personal spending increased 0.4% month-over-month and was up 2.7% year-over-year versus 2.5% in July.
- The personal savings rate, as a percentage of disposable personal income, slipped to 4.6% from 4.8% in July.
- The key takeaway from the report is the lack of headline surprise for the inflation prints. That helped calm some of the market's angst about tariff pass-through being more demonstrable; therefore, it was better than feared, which qualifies in a relative sense as being good. The solid income and spending results were a bonus, befitting an economy that is still on a growth trajectory.
| Category | AUG | JUL | JUN | MAY | APR |
| Personal Income | |||||
| Total Income | 0.4% | 0.4% | 0.3% | -0.4% | 0.8% |
| Wage and Salary | 0.3% | 0.5% | 0.1% | 0.3% | 0.4% |
| Disposable Income | 0.4% | 0.4% | 0.3% | -0.5% | 0.8% |
| Savings Rate | 4.6% | 4.8% | 5.0% | 5.2% | 5.7% |
| Personal Consumption | |||||
| Total (Nominal) | 0.6% | 0.5% | 0.5% | 0.0% | 0.3% |
| Total (Real, Chain $) | 0.4% | 0.4% | 0.3% | -0.1% | 0.1% |
| Core PCE Deflator | |||||
| Month/Month | 0.2% | 0.2% | 0.3% | 0.2% | 0.2% |
| Year/Year | 2.9% | 2.9% | 2.8% | 2.8% | 2.6% |


