

Updated: 14-Jul-26 09:26 ET
Highlights
- Total CPI was down 0.4% month-over-month in June (Briefing.com consensus: -0.1%), which was the largest one-month drop since April 2020. That move was paced by a 5.7% decline in the index for energy.
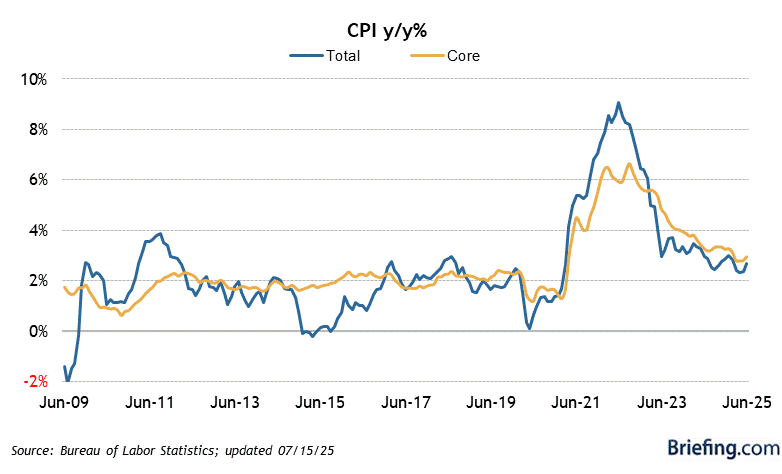
- Core CPI, which excludes food and energy, was unchanged month-over-month (Briefing.com consensus: 0.2%), leaving it up 2.6% year-over-year versus 2.9% in May.
- Total CPI was up 3.5% year-over-year versus 4.2% in May.
- The food index was up 0.2% month-over-month and up 3.0% year-over-year.
- The energy index was down 5.7% month-over-month and up 15.7% year-over-year.
- The shelter index was up 0.1% month-over-month and up 3.3% year-over-year.
- The used cars and trucks index was down 0.2% month-over-month and down 1.8% year-over-year.
- The apparel index was down 0.6% month-over-month and up 3.9% year-over-year.
- The services index was unchanged month-over-month and up 3.2% year-over-year.
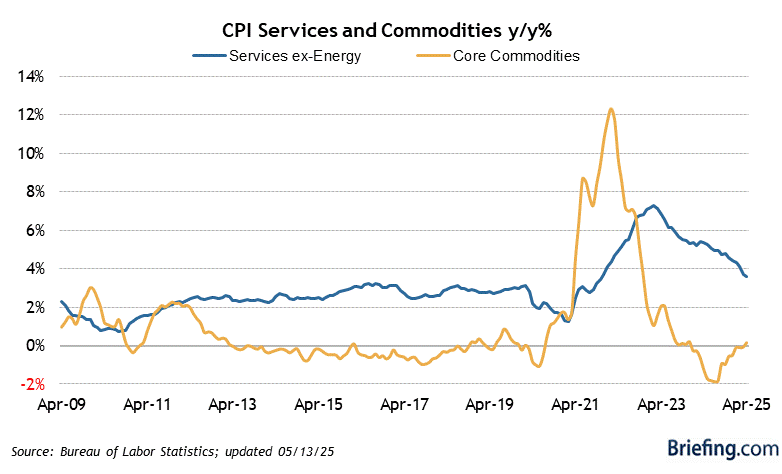
- The all items index, less food, shelter, and energy, was down 0.1% month-over-month and up 2.1% year-over-year.
- From June 2025 to June 2026, real average hourly earnings decreased 0.1%, seasonally adjusted. Real average hourly earnings on a month-over-month basis, though, increased 0.8%.
- The key takeaway from the report is the softening in core inflation and the added softening in super core inflation, which excludes food, energy, and shelter. That component was up just 2.1% year-over-year. Inflation has not been slayed, but this report should be enough to keep the FOMC on hold at its July 28-29 meeting.
| Category | JUN | MAY | APR | MAR | FEB |
| All Items | -0.4% | 0.5% | 0.6% | 0.9% | 0.3% |
| Food and Beverages | 0.2% | 0.2% | 0.5% | 0.0% | 0.4% |
| Housing | 0.0% | 0.2% | 0.7% | 0.3% | 0.3% |
| Equivalent Rent | 0.2% | 0.3% | 0.5% | 0.3% | 0.2% |
| Apparel | -0.6% | 0.3% | 0.6% | 1.0% | 1.3% |
| Transportation | -2.5% | 1.3% | 1.3% | 4.3% | 0.2% |
| Vehicles | 0.0% | -0.2% | -0.2% | -0.1% | -0.1% |
| Motor Fuel | -9.7% | 7.0% | 5.4% | 21.2% | 0.8% |
| Medical Care | -0.1% | 0.3% | -0.1% | -0.2% | 0.5% |
| Educ and Commun | -0.8% | 0.8% | 0.0% | 0.2% | -0.2% |
| Special Indices | |||||
| Core | 0.0% | 0.2% | 0.4% | 0.2% | 0.2% |
| Energy | -5.7% | 3.9% | 3.8% | 10.9% | 0.6% |
| Services | 0.0% | 0.3% | 0.6% | 0.2% | 0.3% |


")
