Updated: 04-Sep-26 09:23 ET
Highlights
- That August employment report caught the market by surprise with its headline strength.
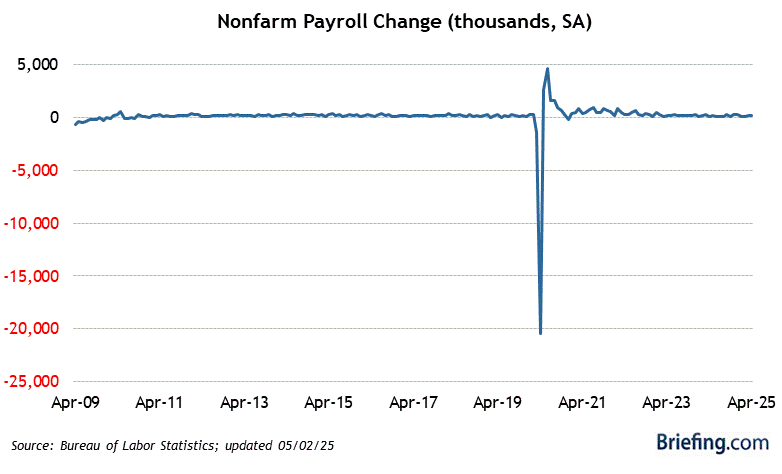
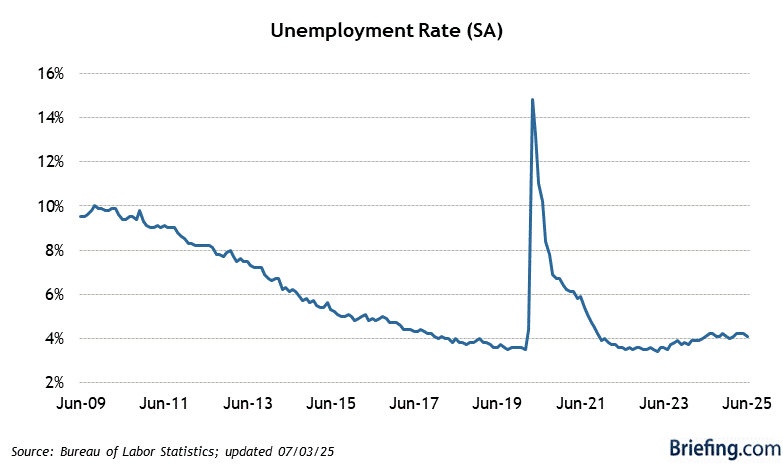
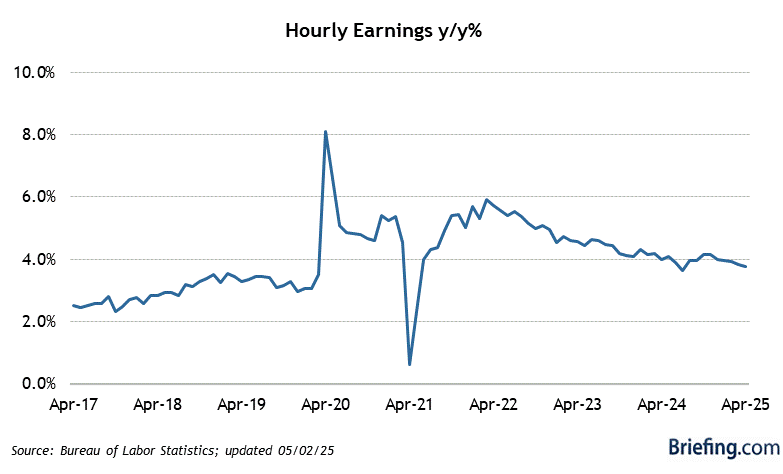
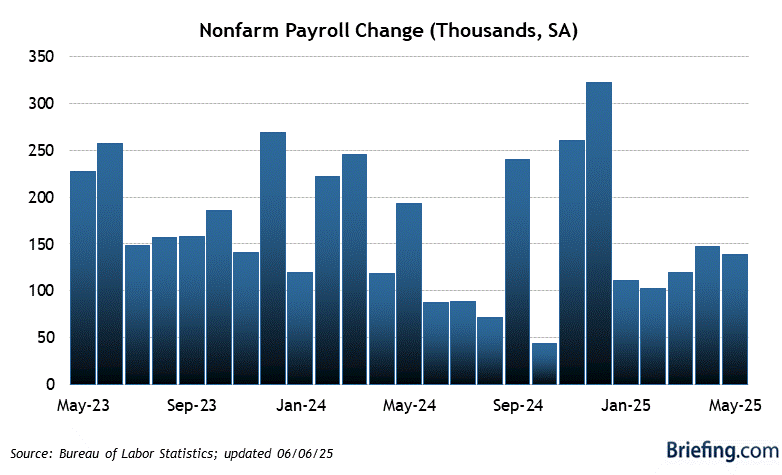
- Nonfarm payrolls increased by 162,000, much better than expected; the unemployment rate of 4.1% was lower than expected; the average workweek at 34.4 hours was higher than expected; and the 0.3% increase in average hourly earnings was as expected.
- August nonfarm payrolls increased by 162,000 (Briefing.com consensus: 45,000). The 3-month average for total nonfarm payrolls increased to 71,000 from 38,000. July nonfarm payrolls revised to 21,000 from -23,000. June nonfarm payrolls revised to 31,000 from 20,000.
- August private sector payrolls increased by 127,000 (Briefing.com consensus: 45,000). July private sector payrolls revised to 71,000 from 30,000. June private sector payrolls revised to 26,000 from 30,000.
- August unemployment rate was 4.1% (Briefing.com consensus: 4.2%) versus 4.1% in July. Persons unemployed for 27 weeks or more accounted for 27.0% of the unemployed versus 25.5% in July. The U6 unemployment rate, which accounts for unemployed and underemployed workers, decreased to 7.7% from 7.9% in July.
- August average hourly earnings were up 0.3% (Briefing.com consensus: 0.3%) on the heels of an upwardly revised 0.2% increase (from 0.1%) in July. Over the last 12 months, average hourly earnings have risen 3.1% versus 3.2% for the 12 months ending in July.
- The average workweek in August was 34.4 hours (Briefing.com consensus: 34.3) versus 34.3 hours in July. The manufacturing workweek increased 0.1 hour to 40.5 hours. Factory overtime was unchanged at 3.1 hours.
- The labor force participation rate increased to 61.6% from 61.4% in July.
- The employment-population ratio increased to 59.1% from 58.9% in July.
- The quick takeaway by the market is that this report just might persuade the Fed to raise rates at its September FOMC meeting. The key takeaway, though, is that a rate hike in September is not assured by this August data. To that end, the 3-month average for total nonfarm payrolls was still just a modest 71,000, there was a moderation in average hourly earnings growth to 3.1% from 3.2% on a year-over-year basis, and persons unemployed for 27 weeks or more accounted for 27.0% of the unemployed versus 25.5% in July.
| Category | AUG | JUL | JUN | MAY | APR |
| Establishment Survey | |||||
| Nonfarm Payrolls | 162K | 21K | 31K | 63K | 148K |
| Goods-Producing | 41K | 29K | 14K | 3K | 6K |
| Construction | 22K | 18K | 3K | 2K | 3K |
| Manufacturing | 16K | 14K | 13K | -2K | -1K |
| Service-Providing | 86K | 42K | 12K | 58K | 144K |
| Retail Trade | 1K | 13K | 10K | 5K | 24K |
| Financial | -11K | -11K | 2K | -20K | -6K |
| Business | 10K | 15K | 36K | 6K | 20K |
| Temporary help | 7K | 5K | 17K | 0K | 11K |
| Education/Health | 29K | 12K | 50K | 24K | 67K |
| Leisure/Hospitality | 62K | -21K | -54K | 42K | -7K |
| Government | 35K | -50K | 5K | 2K | -2K |
| Average Workweek | 34.4 | 34.3 | 34.3 | 34.3 | 34.3 |
| Production Workweek | 33.8 | 33.8 | 33.8 | 33.8 | 33.8 |
| Factory Overtime | 4.0 | 4.0 | 4.1 | 4.0 | 4.0 |
| Aggregate Hours Index | 0.3% | 0.1% | 0.0% | 0.1% | 0.3% |
| Avg Hourly Earnings | 0.3% | 0.2% | 0.3% | 0.2% | 0.2% |
| Household Survey | |||||
| Household Survey | |||||
| Civilian Unemp. Rate | 4.1% | 4.1% | 4.2% | 4.3% | 4.3% |
| Civilian Labor Force | 683K | -264K | -720K | 83K | -92K |
| Civilian Employed | 569K | -87K | -507K | 149K | -226K |
| Civilian Unemployed | 115K | -178K | -213K | -66K | 134K |