Updated: 15-Oct-26 09:49 ET
Highlights
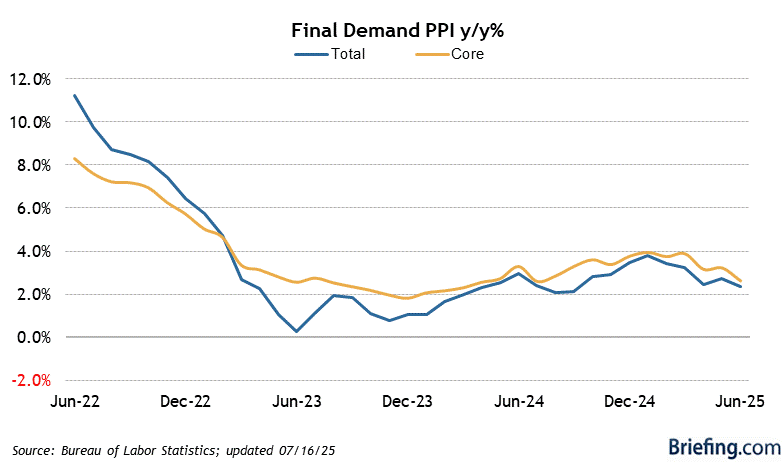
- The Producer Price Index for final demand increased 1.3% month-over-month in September (Briefing.com consensus: 0.5%) following a 0.5% increase in August. The September increase was the largest increase since March 2022 and left the index up 6.3% year-over-year versus 5.6% in August.
- The index for final demand, less food and energy, rose 0.7% (Brieifng.com consensus: 0.3%) following a 0.2% increase in August. The September increase left the index up 5.0% year-over-year versus 4.8% in August.
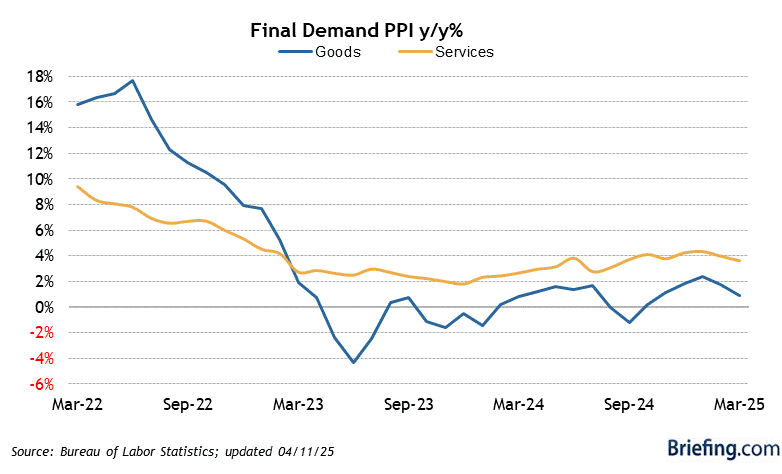
- The index for final demand goods surged 2.6%, the largest increase since data were first calculated in 2009, paced by a 10.8% increase in prices for final demand energy.
- The index for final demand services was up 0.8%, led by a 1.4% increase in margins for final demand trade services.
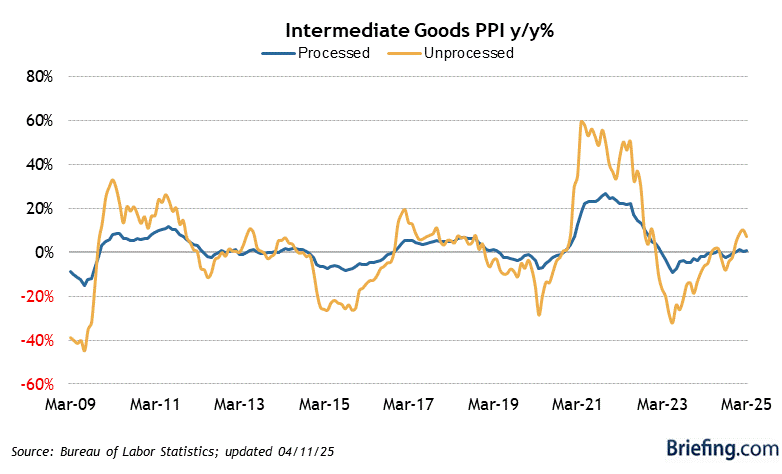
- The index for processed goods for intermediate demand rose 2.5%, paced by a 10.2% jump in prices for processed energy goods.
- The index for unprocessed goods for intermediate demand moved up 8.4%, the largest increase since February 2022, mostly due to a 22.2% increase in prices for unprocessed energy materials.
- The key takeaway from the report is the accelerated pace of inflation at the wholesale level. That will be looked at by many as a setup for ongoing pass-through price pressures for the consumer.
| Category | SEP | AUG | JUL | JUN | MAY |
| Final Demand | 1.3% | 0.5% | 0.2% | -0.1% | 0.5% |
| Core (excluding ...) | |||||
| Food and Energy | 0.7% | 0.2% | 0.3% | 0.4% | 0.0% |
| Food, Energy, and Trade | 0.5% | 0.3% | 0.5% | 0.2% | 0.8% |
| Final Demand Goods | |||||
| Total | 2.6% | 1.1% | -0.4% | -1.4% | 2.2% |
| Energy | 10.8% | 4.5% | -1.7% | -6.8% | 8.2% |
| Finished Goods | 2.7% | 0.8% | -0.3% | -1.5% | 2.4%` |
| Final Demand Services | |||||
| Total | 0.8% | 0.2% | 0.3% | 0.5% | -0.2% |
| Trade | 1.4% | 0.2% | -0.2% | 1.3% | -2.7% |
| Intermediate Demand | |||||
| Processed | 2.5% | 1.8% | -0.4% | -1.0% | 2.7% |
| Unprocessed | 8.4% | 0.9% | -0.2% | -6.5% | 3.0% |
| Services | 0.9% | 0.7% | 0.2% | 0.8% | 0.5% |