Updated: 13-Jan-26 08:53 ET


Highlights
- Total CPI was up 0.3% month-over-month in December (Briefing.com consensus 0.3%) after increasing 0.2% in November. Core CPI, which excludes food and energy, was up 0.2% (Briefing.com consensus 0.3%) after increasing 0.2% in November.
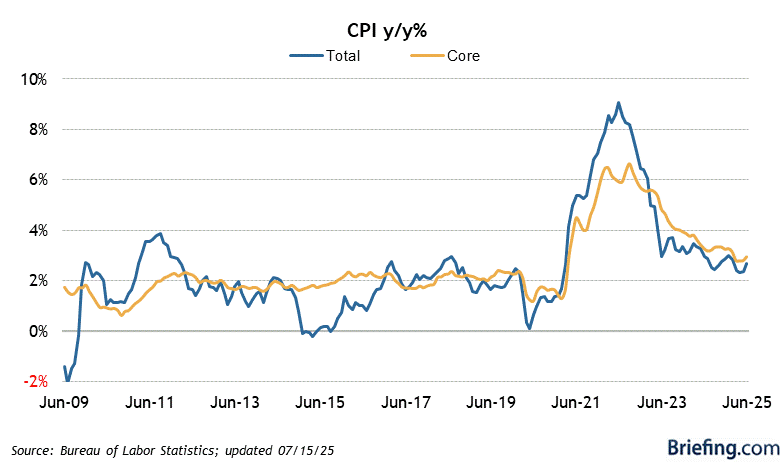
- On a year-over-year basis, total CPI was up 2.7% versus 2.7% in November, while core CPI was up 2.6% versus 2.6% in November.
- The food index was up 0.3% month-over-month and was up 2.7% year-over-year.
- The energy index was up 0.7% month-over-month and was up 2.3% year-over-year.
- The shelter index was up 0.4% month-over-month and up 3.2% year-over-year.
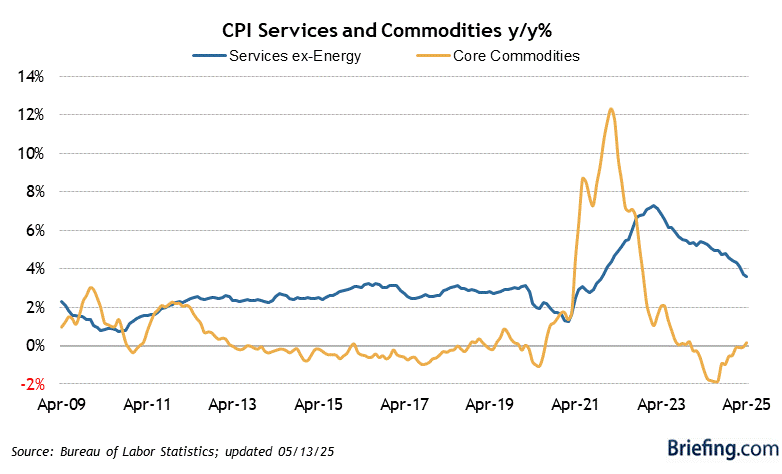
- The services index was up 3.3% year-over-year (services less rent of shelter was up 3.4% year-over-year).
- The all items index less food, shelter, and energy was up 2.6% year-over-year.
- The key takeaway from the report is that core CPI was a touch cooler than expected, which prevented the year-over-year rate from rising. While this is a small victory, it is a welcome sight for a market that hopes to see some more future disinflation that would encourage the Fed to keep cutting rates.
| Category | DEC | NOV | OCT | SEP | AUG |
| All Items | 0.3% | -- | -- | 0.3% | 0.4% |
| Food and Beverages | 0.7% | -- | -- | 0.2% | 0.5% |
| Housing | 0.4% | -- | -- | 0.2% | 0.4% |
| Equivalent Rent | 0.3% | -- | -- | 0.1% | 0.4% |
| Apparel | 0.6% | -- | -- | 0.7% | 0.5% |
| Transportation | 0.0% | -- | -- | 0.8% | 0.9% |
| Vehicles | -0.4% | -- | -- | 0.0% | 0.4% |
| Motor Fuel | -0.5% | 3.0% | -2.1% | 4.1% | 1.9% |
| Medical Care | 0.4% | -- | -- | 0.2% | -0.2% |
| Educ and Commun | -1.0% | -- | -- | 0.0% | 0.0% |
| Special Indices | |||||
| Core | 0.2% | -- | -- | 0.2% | 0.3% |
| Energy | 0.3% | -- | -- | 1.5% | 0.7% |
| Services | -- | -- | 0.2% | 0.3% |


