Updated: 16-Dec-25 09:58 ET


Highlights
- The November Employment Situation Report wasn't all bad, but it certainly wasn't all good either. The nonfarm and private payrolls data were better than expected, but the unemployment rate was worse than expected.
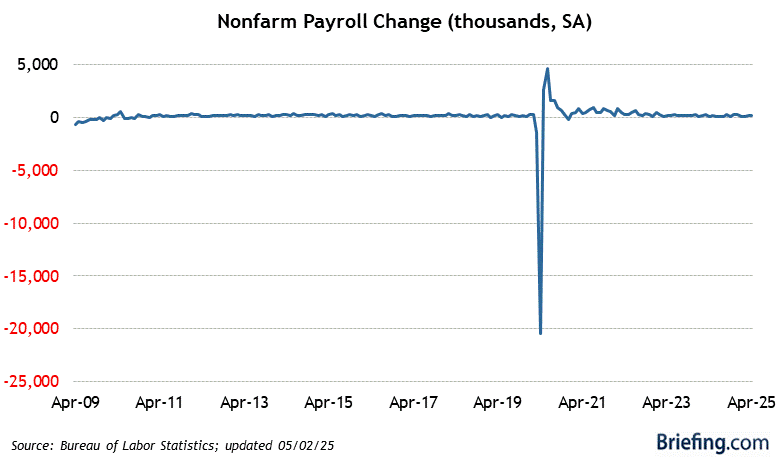
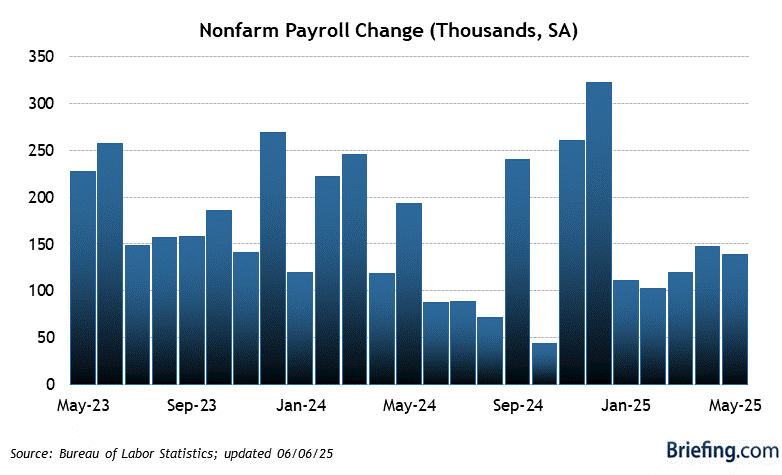
- November nonfarm payrolls increased by 64,000 (Briefing.com consensus: 30,000). The 3-month average for total nonfarm payrolls increased to 22,000 from -8,000. October nonfarm payrolls -105,000. September nonfarm payrolls revised to 108,000 from 119,000.
- November private sector payrolls increased by 69,000 (Briefing.com consensus: 34,000). October private sector payrolls 52,000. September private sector payrolls revised to 104,000 from 97,000.
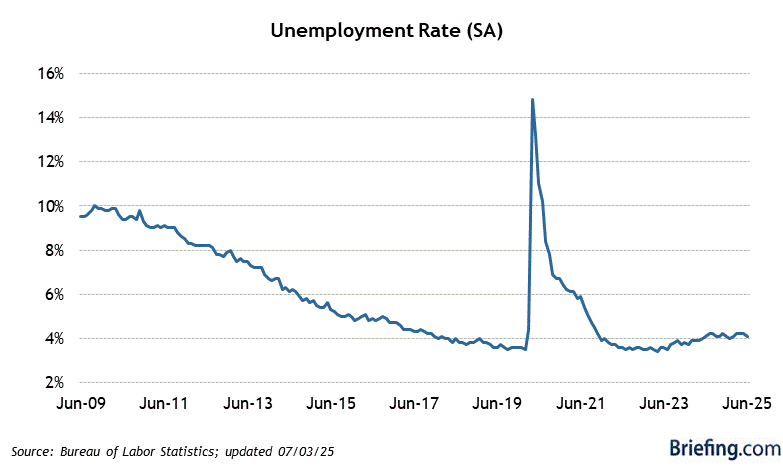
- November unemployment rate was 4.6% (Briefing.com consensus: 4.4%) versus 4.4% in September. Persons unemployed for 27 weeks or more accounted for 24.3% of the unemployed versus 23.6% in September. The U6 unemployment rate, which accounts for unemployed and underemployed workers, increased to 8.7% from 8.0% in September.
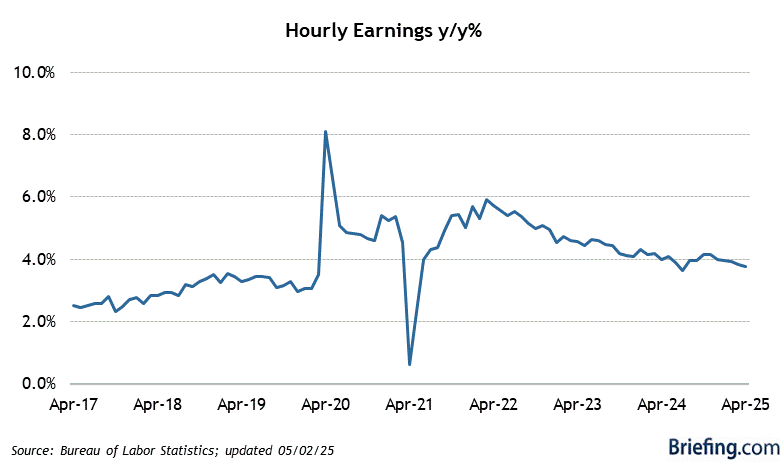
- November average hourly earnings were up 0.1% (Briefing.com consensus: 0.3%) versus a 0.4% increase in October. Over the last 12 months, average hourly earnings have risen 3.5% versus 3.8% for the 12 months ending in October.
- The average workweek in November was 34.3 hours (Briefing.com consensus: 34.3) versus 34.2 hours in October. The manufacturing workweek changed little at 40.0 hours. Factory overtime was unchanged at 2.9 hours.
- The labor force participation rate increased to 62.5% from 62.4% in September.
- The employment-population ratio decreased to 59.6% from 59.7% in September.
- The key takeaway from the employment report will be the bump in the official unemployment rate and the softening in the U-6 unemployment rate. Both have helped substantiate the Fed's concerns about downside risk to employment that served as the basis for the December cut.
| Category | NOV | OCT | SEP | AUG | JUL |
| Establishment Survey | |||||
| Nonfarm Payrolls | 64K | -105K | 108K | -26K | 72K |
| Goods-Producing | 19K | -9K | 17K | -33K | -16K |
| Construction | 28K | -1K | 25K | -20K | -3K |
| Manufacturing | -5K | -9K | -5K | -11K | -9K |
| Service-Providing | 50K | 61K | 87K | 43K | 72K |
| Retail Trade | 6K | -2K | 23K | 5K | 6K |
| Financial | -2K | -3K | 6K | -15K | 1K |
| Business | 12K | -7K | -8K | -13K | -13K |
| Temporary help | -5K | -13K | -6K | -10K | -15K |
| Education/Health | 65K | 59K | 56K | 34K | 80K |
| Leisure/Hospitality | -12K | 16K | 42K | 23K | 9K |
| Government | -5K | -157K | 4K | -36K | 16K |
| Average Workweek | 34.3 | 34.2 | 34.2 | 34.2 | 34.3 |
| Production Workweek | 33.7 | 33.7 | 33.7 | 33.6 | 33.7 |
| Factory Overtime | 3.9 | 3.8 | 3.8 | 3.7 | 3.7 |
| Aggregate Hours Index | 0.3% | 0.0% | 0.1% | -0.3% | 0.3% |
| Avg Hourly Earnings | 0.1% | 0.4% | 0.2% | 0.4% | 0.3% |
| Household Survey | |||||
| Household Survey | |||||
| Civilian Unemp. Rate | 4.6% | 4.4% | 4.3% | 4.2% | |
| Civilian Labor Force | 470K | 436K | -38K | ||
| Civilian Employed | 251K | 288K | -260K | ||
| Civilian Unemployed | 219K | 148K | 221K |


