

Updated: 14-May-26 09:26 ET
Highlights
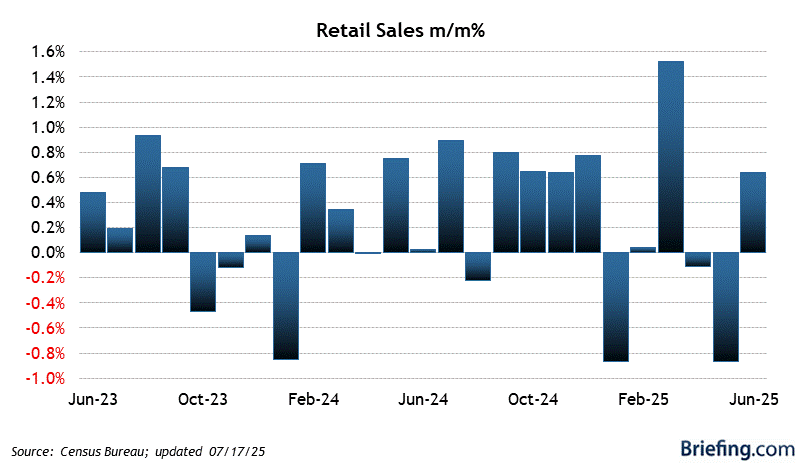
- Total retail sales increased 0.5% month-over-month in April (Briefing.com consensus: 0.4%) following a downwardly revised 1.6% increase (from 1.7%) in March.
- Excluding autos, retail sales rose 0.7% month-over-month (Briefing.com consensus: 0.4%) after increasing 1.9% in March.
- Motor vehicle and parts dealer sales decreased 0.4% following a 0.6% increase in March.
- Gasoline station sales rose 2.8% following a 13.7% increase in March.
- Clothing and clothing accessories stores sales fell 1.5% month-over-month following a 0.5% increase in March.
- Nonstore retailer sales jumped 1.1% after increasing 0.8% in March.Food services and drinking places sales increased 0.6% following a 0.1% increase in March.
- Furniture and home furnishing store sales dropped 2.0% following a 2.6% increase in March.
- General merchandise store sales were up 0.1% month-over-month after increasing 1.1% in March.
- Electronics and appliance store sales increased 1.4% following a 1.3% increase in March.
- Building material and garden equipment and supplies dealer sales edged 0.1% higher after increasing 1.1% in March.
- The key takeaway from the report is that solid spending activity was seen across most retail categories in April, which is when consumers were digesting the gas price shock from the Iran war. Excluding auto and gasoline station sales, retail sales were up 0.5% month-over-month.
| Category | APR | MAR | FEB | JAN | DEC |
| Retail Sales | 0.5% | 1.6% | 0.9% | 0.0% | 0.0% |
| Excluding Autos | 0.7% | 1.9% | 0.9% | 0.1% | 0.0% |
| Durable goods | |||||
| Building Materials | 0.1% | 1.1% | 0.5% | 0.7% | 1.1% |
| Autos/parts | -0.4% | 0.6% | 1.0% | -0.7% | 0.0% |
| Furniture | -2.0% | 2.6% | -0.4% | 1.1% | -1.9% |
| Nondurable goods | |||||
| General Merchandise | 0.1% | 1.1% | 0.1% | 0.5% | -0.1% |
| Food | 0.8% | 1.0% | -1.1% | 0.0% | 0.2% |
| Gasoline stations | 2.8% | 13.7% | 1.7% | -2.2% | 0.4% |
| Clothing | -1.5% | 0.5% | 2.6% | -0.4% | -0.8% |
| e*retailing/non-store | 1.1% | 0.8% | 1.8% | 1.8% | 0.0% |

")
